

How-to
Create and Manage Tiles:
Diagrams
This is a tile-specific continuation of How-to Create and Manage Tiles.
This section guides users on how to create and manage diagram tile.
A diagram is a symbolic representation of information using visualization techniques.
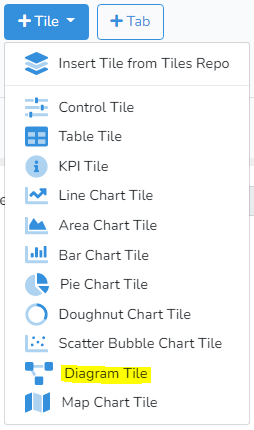
To create a new diagram, click on +Tile in the project edit mode. Then select Diagram Tile from the drop-down menu.
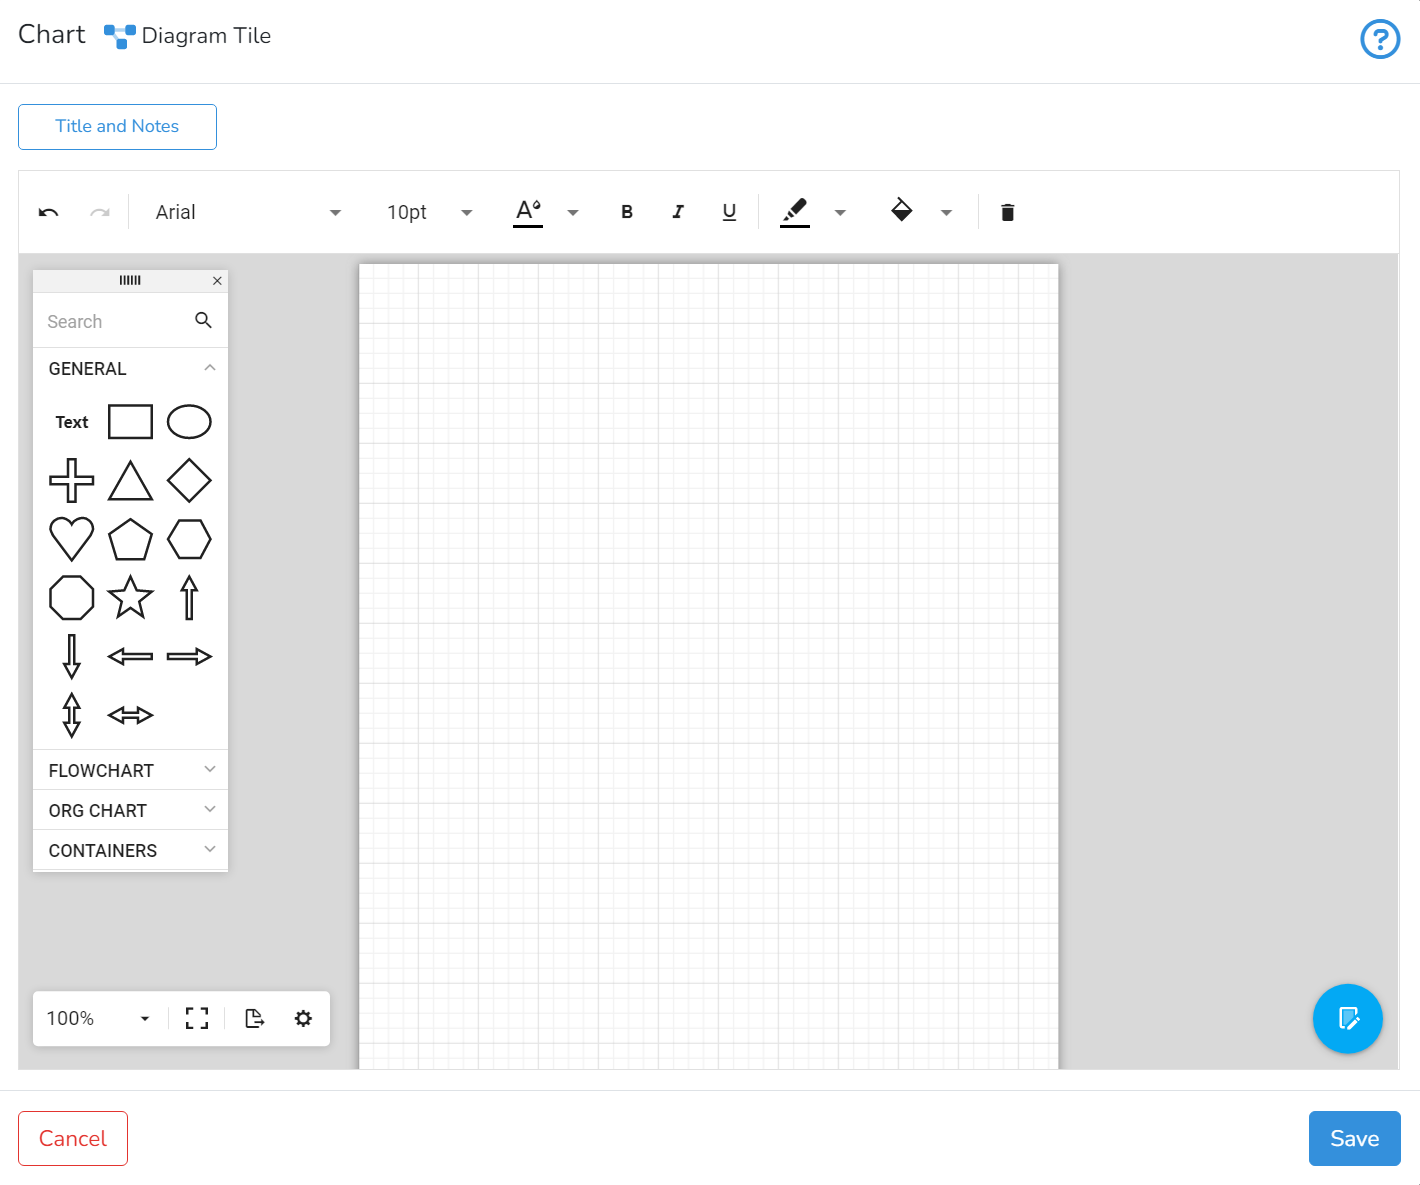 The user is recommended to choose the diagram title and provide some additional useful descriptions or details in the provided input boxes Title and Notes.
To construct a diagram, the user can select shapes and blocks provided in 4 different categories from the window on the left and drag them onto the grid area.
The user can also use the search bar at the top of the window to search through the shapes and blocks.
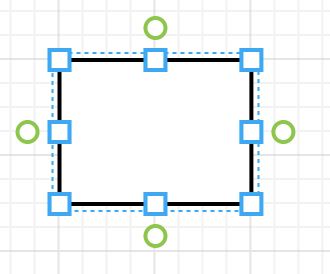
By double-clicking on the shape, the user can add the text to the shape, and edit the size of the figure by clicking and dragging the blue squares into the desired size. The user can also link shapes with an arrow by clicking and dragging the green circles of one shape to another shape.
The toolbar above the grid area allows editing the text's size, font, and other attributes by double-clicking on the text and selecting the respective icons.
![]()
The user can change the colour of the shape outline by clicking on ![]() , and of the shape area colour by clicking on
, and of the shape area colour by clicking on ![]() and selecting the preferred colour.
and selecting the preferred colour.
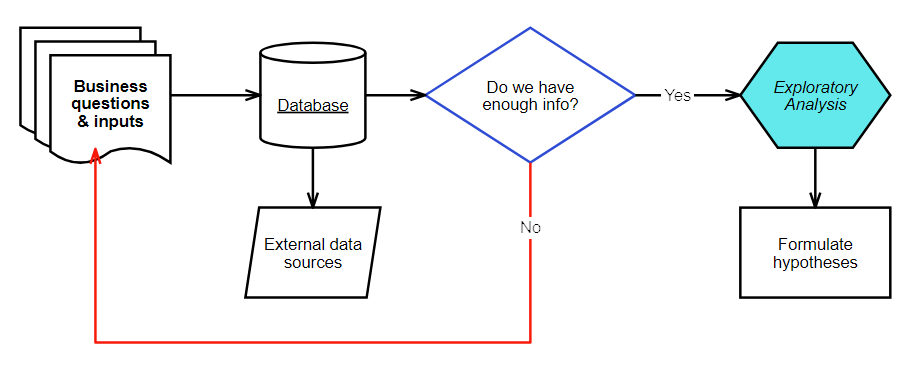
The project below demonstrates the use of the described functions.
A small toolbar in the bottom left corner provides additional functionalities, such as modifying the zoom level, switching to the full screen, exporting the tile, and changing the settings
![]()
Clicking on the Save button in the bottom right corner of the window saves the changes and shows the diagram tile as part of the project.
Next is How-to Create KPIs.