Step 1: Data Connection
On selecting KPI Tile - a dialog similar to the picture below will be opened.
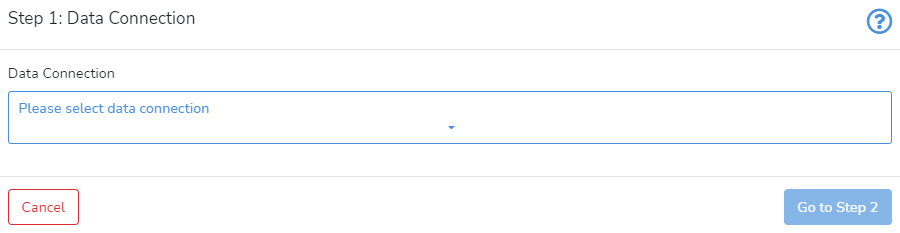
In Step 1, the user should select the connection. Next, click on Go to Step 2.


This is a tile-specific continuation of How-to Create and Manage Tiles.
This section guides users on how to create and manage KPI tile.
The KPI stands for Key Performance Indicator. This tile enables users to show the key performance indicator as a single value. It enriches the range of visualization types and lets the important numbers stand out.
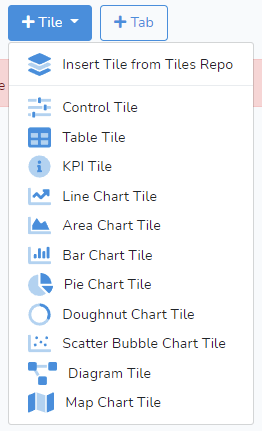 To create a new KPI Tile, click on +Tile in the project edit mode. Then select the KPI Tile. Adding and editing the tile is done in three steps: selecting the data connection, selecting the data, and formatting the chart.
On selecting KPI Tile - a dialog similar to the picture below will be opened.
In Step 1, the user should select the connection. Next, click on Go to Step 2.
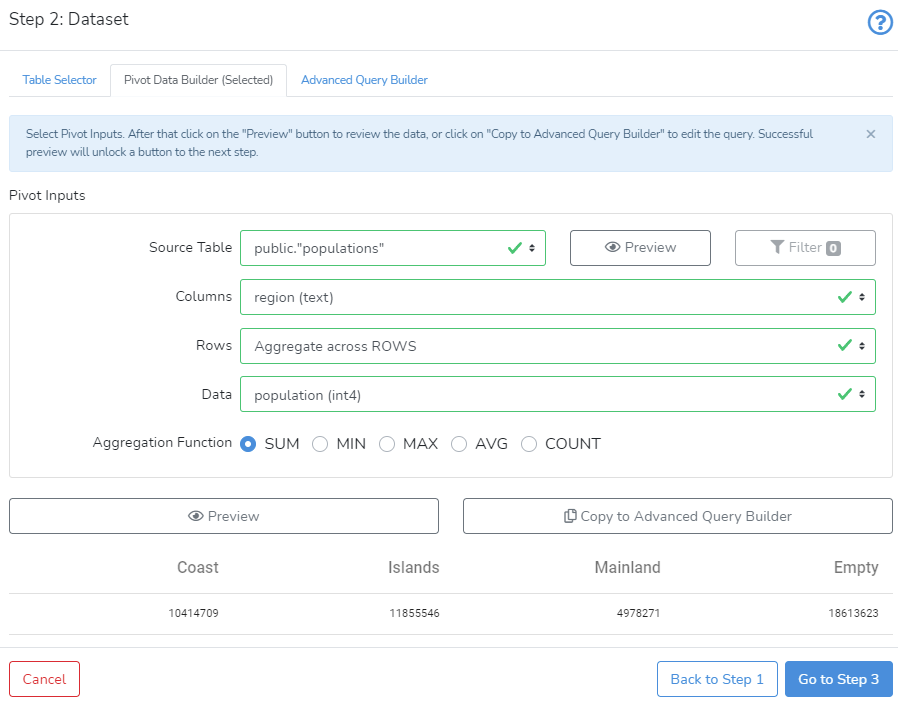
In Step 2, the user can select one of the available dataset selectors. KPI requires only one number. Ideally, the user should provide a query or use a pivot data builder which produces just one number.
If the DataYeet platform detects more than one numeric value - at step 3, the user will be offered to select the column with a numeric value, the column with identification values, and the selection of exact identification value.
Once done - click on Preview. It will enable the button to go to Step 3. Click on Go to Step 3 to move to the next step.
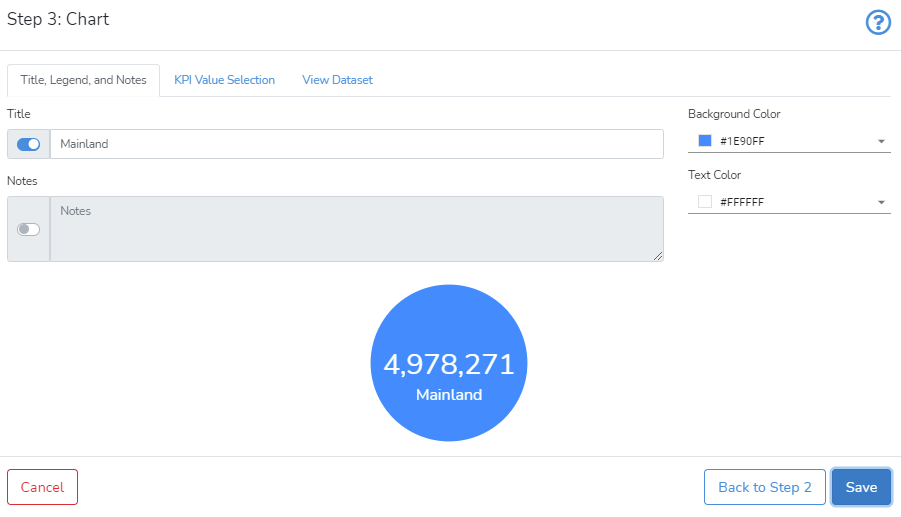
In Step 3, there are three tabs with KPI settings: Title, Legend, and Notes, KPI Value Selection, and View Dataset.
In Title, Legend, and Notes the user can provide the title and the notes. When enabled - the title is displayed below the KPI value. Enabled notes will appear as an overlay box. Additionally, here the user can change the background color of the KPI's round area and the text color of the KPI.
In KPI Value Selection the user should select variables when there is more than one row and column are in the dataset. If this is the case - the user should, first, select a variable that will be used to identify which row contains the KPI value. Second, the user should select the value from the selected variable to identify the row. Finally, the user should select the variable with the KPI value.
In the case when there is one row in the dataset with several variables - the user should only select the value variable. Other input fields will be disabled as they are not required.
In View Dataset the user can inspect the dataset to select correct variables and the value to locate the KPI value.
When ready - click Save to create the KPI reflection tile.
Next is How-to Manage Table Tiles.