

How-to
Create and Manage Tiles:
Pivot Tables
This is a pivot-table-specific part of How-to Create and Manage Tiles.
This section guides users on how to create and manage pivot table content tiles.
DataYeet allows users to present data as a pivot table. Pivot Table tile allows sorting order of columns and row headers, drilling down, filtering, calculating totals, aggregations and conditional formatting.
The user needs to have at least one data connection before any tiles can be added.
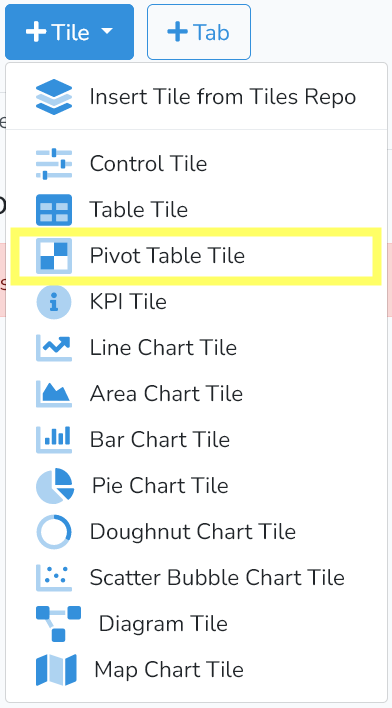
To create a new Pivot Table Tile, click on +Tile in the project edit mode. Then select Pivot Table Tile highlighted in the picture above.
For most of the content tiles, adding and editing the tile is done in three steps:
1) Selecting the data connection.
2) Selecting the data, and
3) Formatting the chart.
Steps 1 and 2 are described in How-to Create and Manage Content Tiles: Charts.
After completing Steps 1 and 2, Step 3 will bring up the window as shown below.

Title and Notes
By clicking on Title and Notes the user can specify the Table Title and Notes, which may help with the interpretation of the table.
These fields are optional and the user can control with the switches next to the input fields whether the information should be shown.
Unlike the Table Tile, where the table content is populated automatically based on the provided data, with the Pivot Table Tile - the user need to select which columns will be used in the pivot table .
Column Fields
Column fields define which dataset variable values will be used to aggregate data across columns. If more than one variable is selected - the pivot table allows drilling into these fields.
To define column fields in the pivot table - click on the field selector icon ![]() and select the required variables by dragging them from All Fields to Column Fields or by clicking on one or more fields in the All Fields area as show below.
and select the required variables by dragging them from All Fields to Column Fields or by clicking on one or more fields in the All Fields area as show below.
There should be at least one field selected for column fields.
Row Fields
Row fields define which dataset variable values will be used to aggregate data across rows. If more than one variable is selected - the pivot table allows drilling into these fields.
To define row fields in the pivot table - click on the field selector icon ![]() and select the required variables by dragging them from All Fields to Row Fields as shown below.
and select the required variables by dragging them from All Fields to Row Fields as shown below.
There should be at least one field selected for row fields.
Data Fields
Data fields define which dataset variables will be aggregated. If more than one variable is selected - the pivot table will present the aggregations next to each other.
To define data fields in the pivot table - click on the field selector icon ![]() and drag the required variable(s) from All Fields to the Data Fields area as shown below.
and drag the required variable(s) from All Fields to the Data Fields area as shown below.
There must be at least one variable selected for data fields.
By default - the data is aggregated by the Count function. For fields with numeric values - DataYeet supports the following aggregation functions: Count, Sum, Avg, Min, Max.
To change the aggregation function - right click on the Data Field in the upper-left corner and under Summary Type - select the required aggregation function as shown below.
 In addition to the aggregation functions, DataYeet provides additional summary display modes: Absolute Variation, Percent Variation, Percent of Column Total, Percent of Row Total, Percent of Column Grand Total, Percent of Row Grand Total, Percent of Grand Total. By default it is None.
To change the summary display mode - right click on the Data Field in the upper-left corner and under Summary Display Modes - select the required display mode as shown below.
When the output of selected display mode is in percent - the format will be automatically adjusted.
Filter Fields
Filter fields define which dataset variable(s) will be used to filter data.
To define filter variables in the pivot table - click on the field selector icon ![]() and select the required variables by dragging them from All Fields to the Filter Fields area as shown below.
and select the required variables by dragging them from All Fields to the Filter Fields area as shown below.
It is optional to select filter variables.
To further configure the pivot table - there are two other configuration tabs Table Settings and Variable Settings.
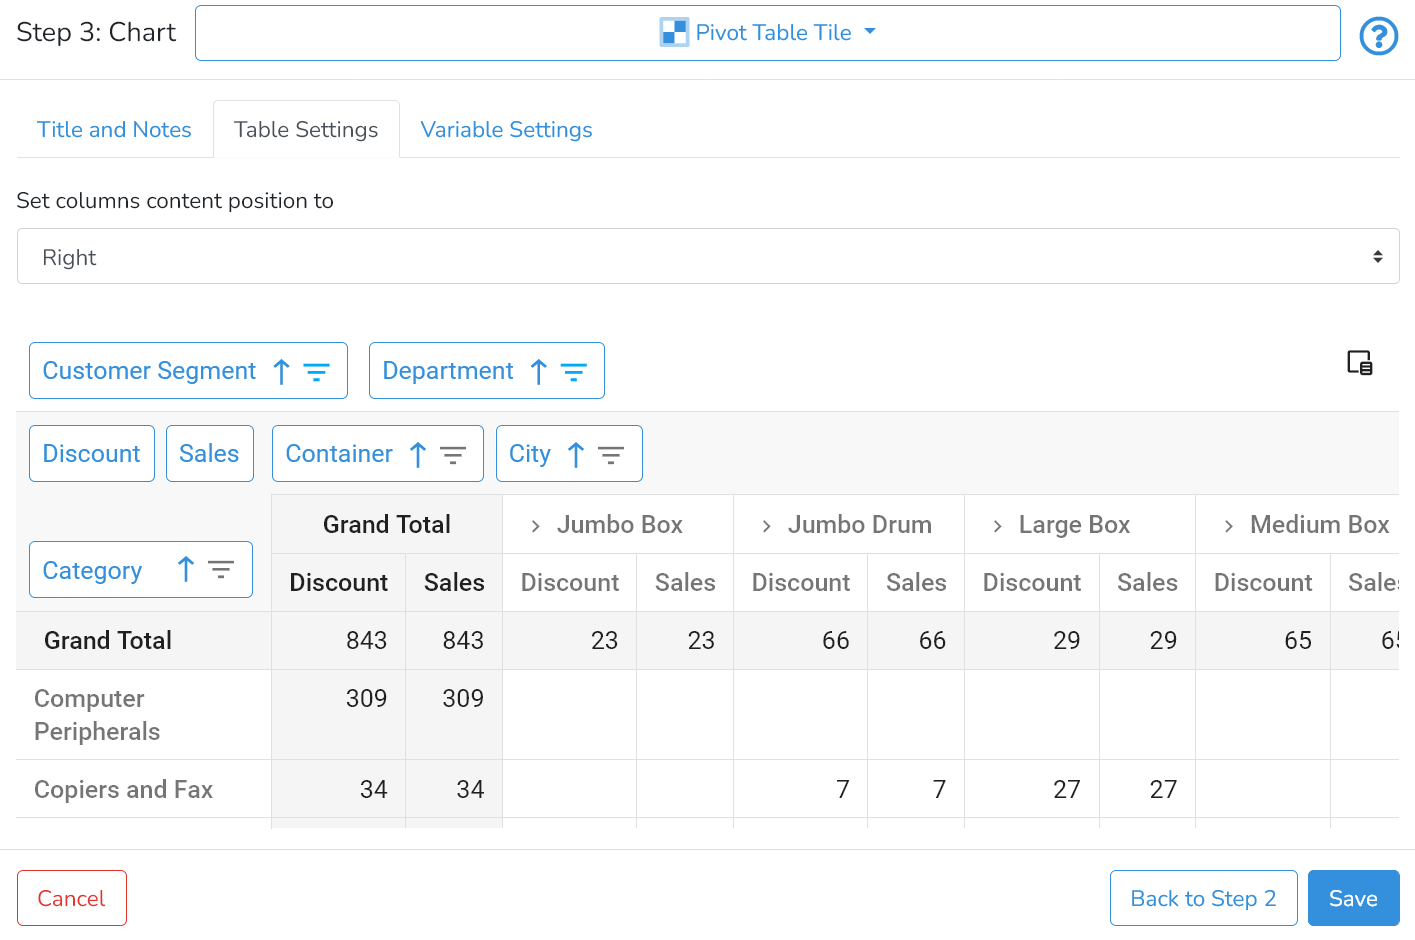
Table Settings
In Table Settings users can choose how the pivot table content is centred: left, centre, or right (default).
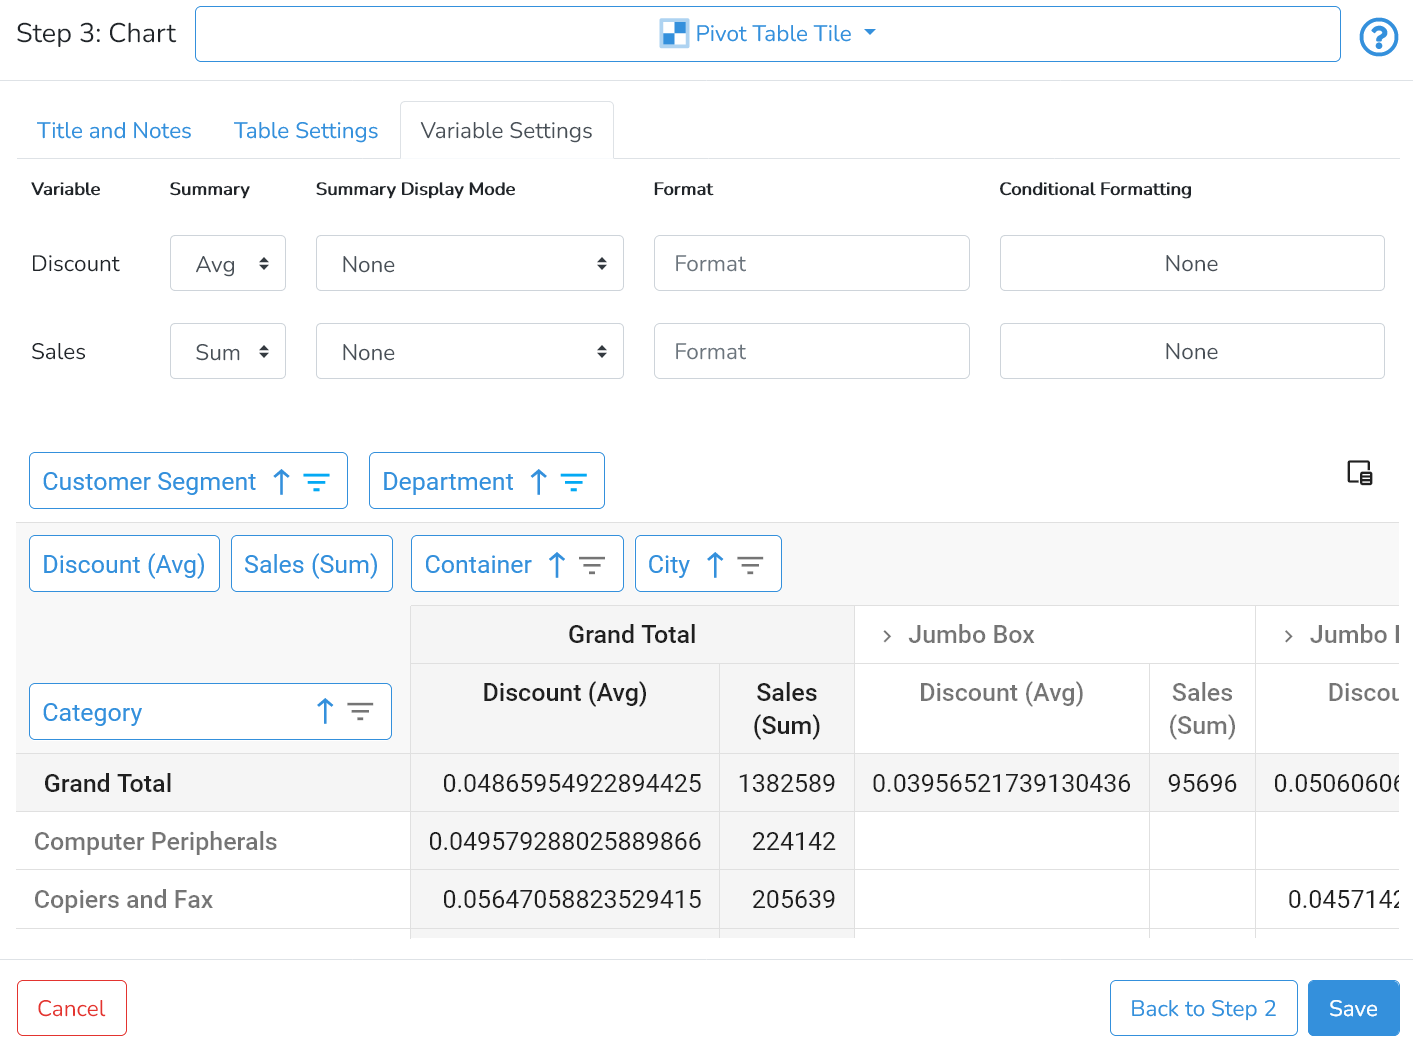
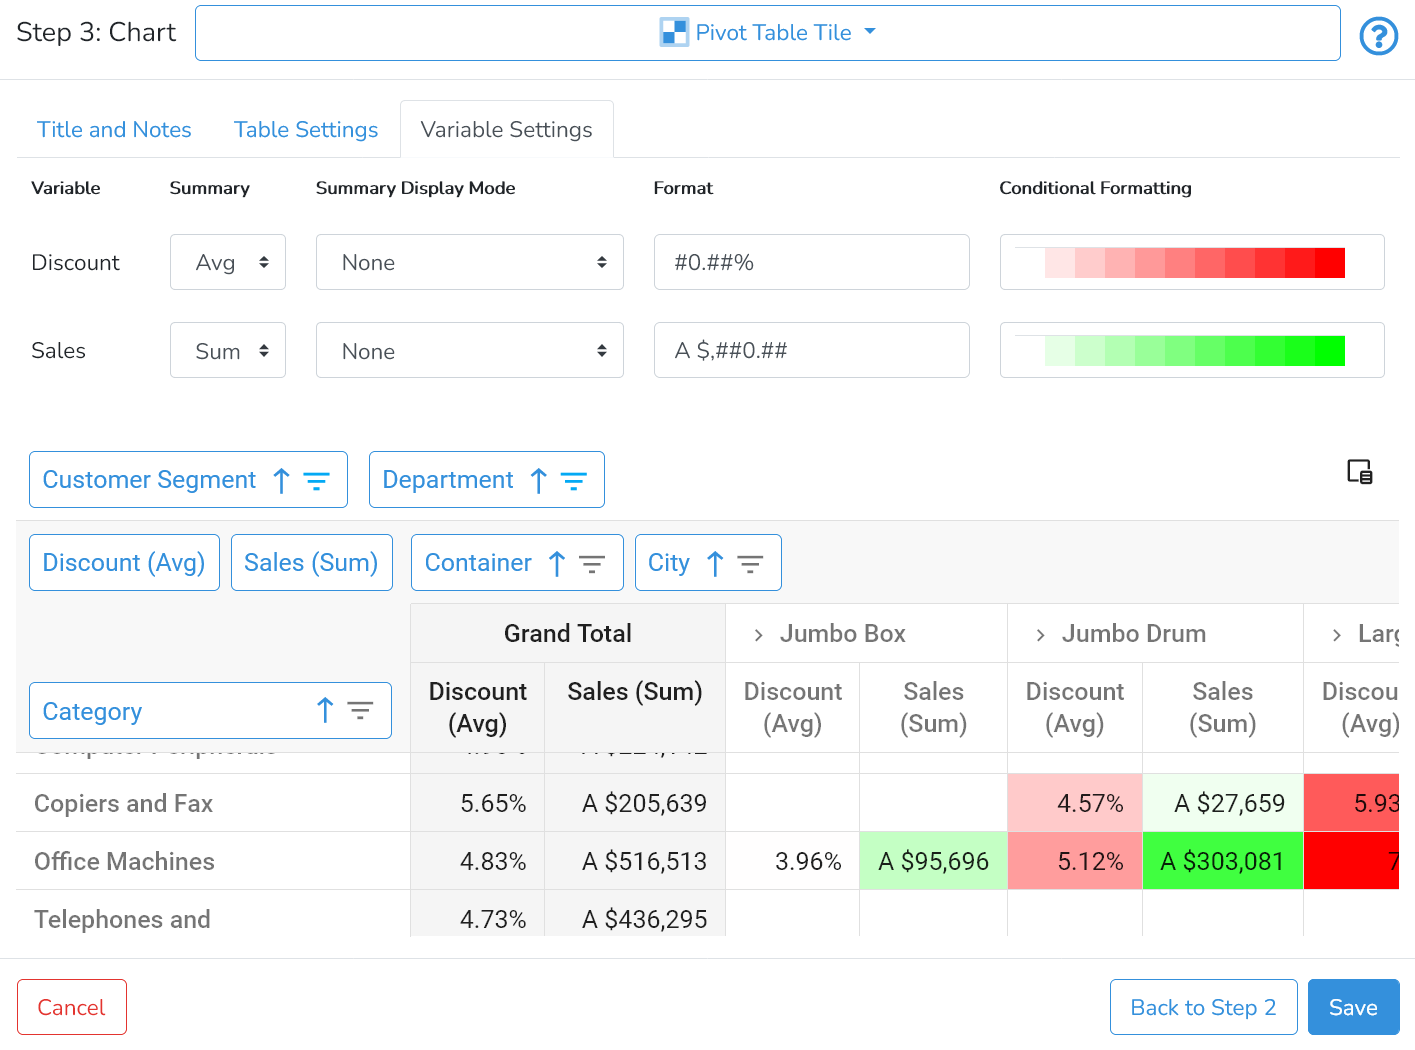
Variable Settings
The Variable Settings tab allows users to configure the following settings on variables in Data Fields: Summary (function), Summary Display Mode, Format, and Conditional Formatting.
Summary (Function)
By default - the data is aggregated by the Count function. For fields with numeric values - DataYeet supports the following aggregation functions: Count, Sum, Avg, Min, Max.
To change the summary (aggregation) function - select the required aggregation function from a dropdown list.
Summary Display Mode
DataYeet provides the following summary display modes: Absolute Variation, Percent Variation, Percent of Column Total, Percent of Row Total, Percent of Column Grand Total, Percent of Row Grand Total, Percent of Grand Total. By default it is None.
To change the summary display mode - select the required display mode from a dropdown list.
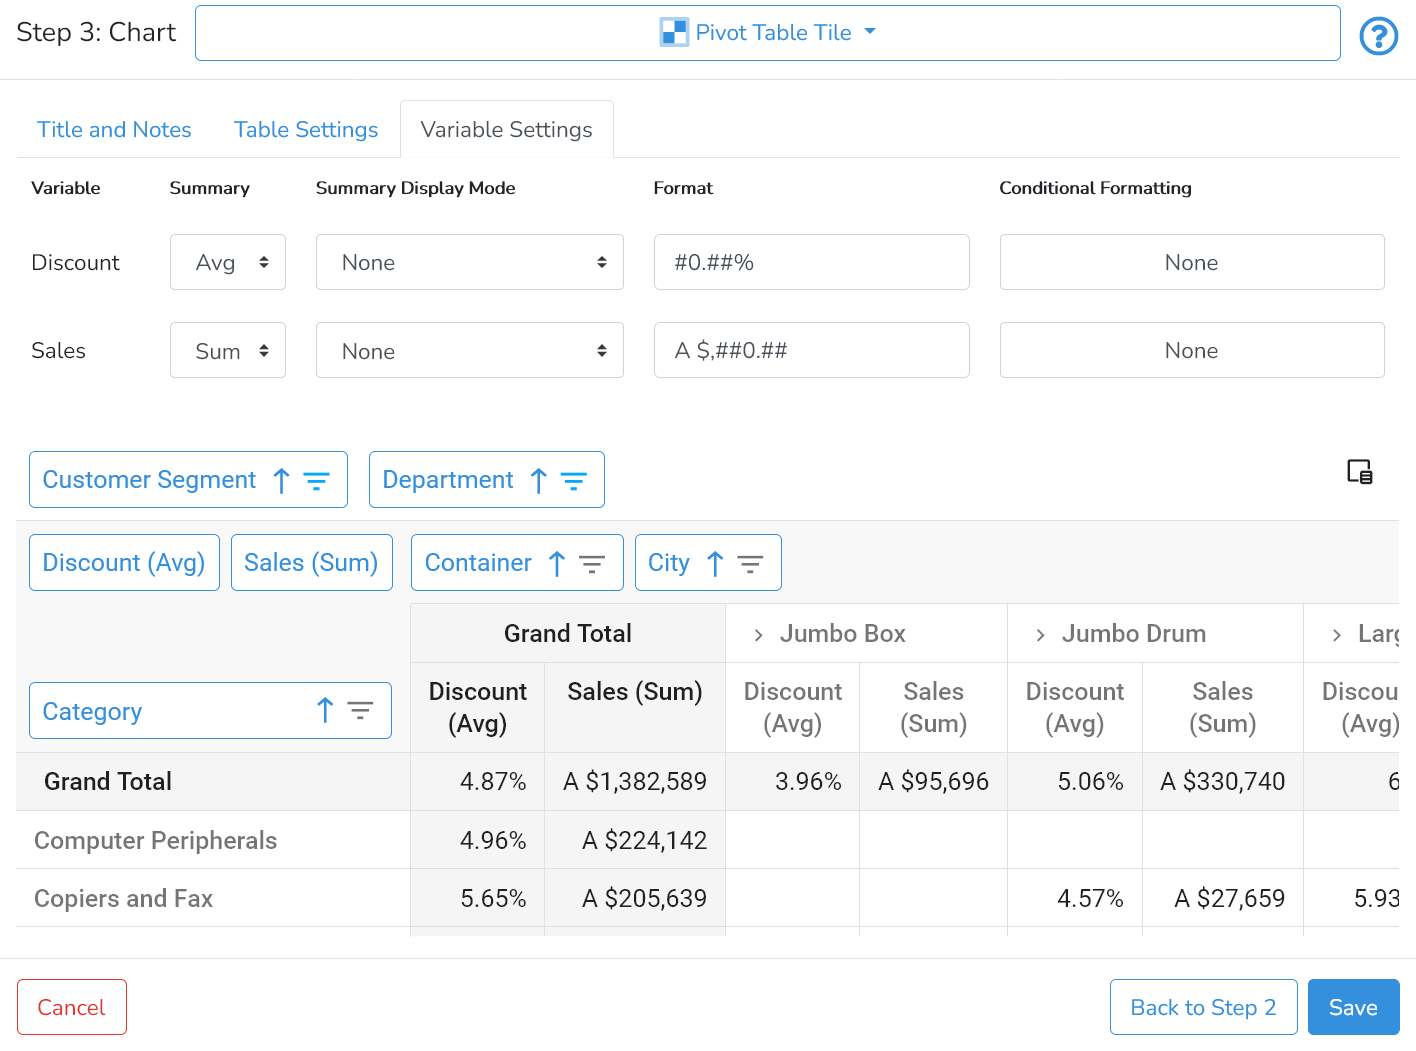
Format
By default, there is no formatting for data field variables. DataYeet supports number format patterns and keywords.
Number format patterns determine how numbers are interpreted in a localized context. For details see here.
For example, the "." shows where the decimal point should go. The "," shows where the thousands separator should go. A "0" indicates zero-padding: if the number is too short, a zero (in the locale's numeric set) will go there. A "#" indicates no padding: if the number is too short, nothing goes there.
To set the format - either select it from the dropdown list of common formats or type it in the Format column.
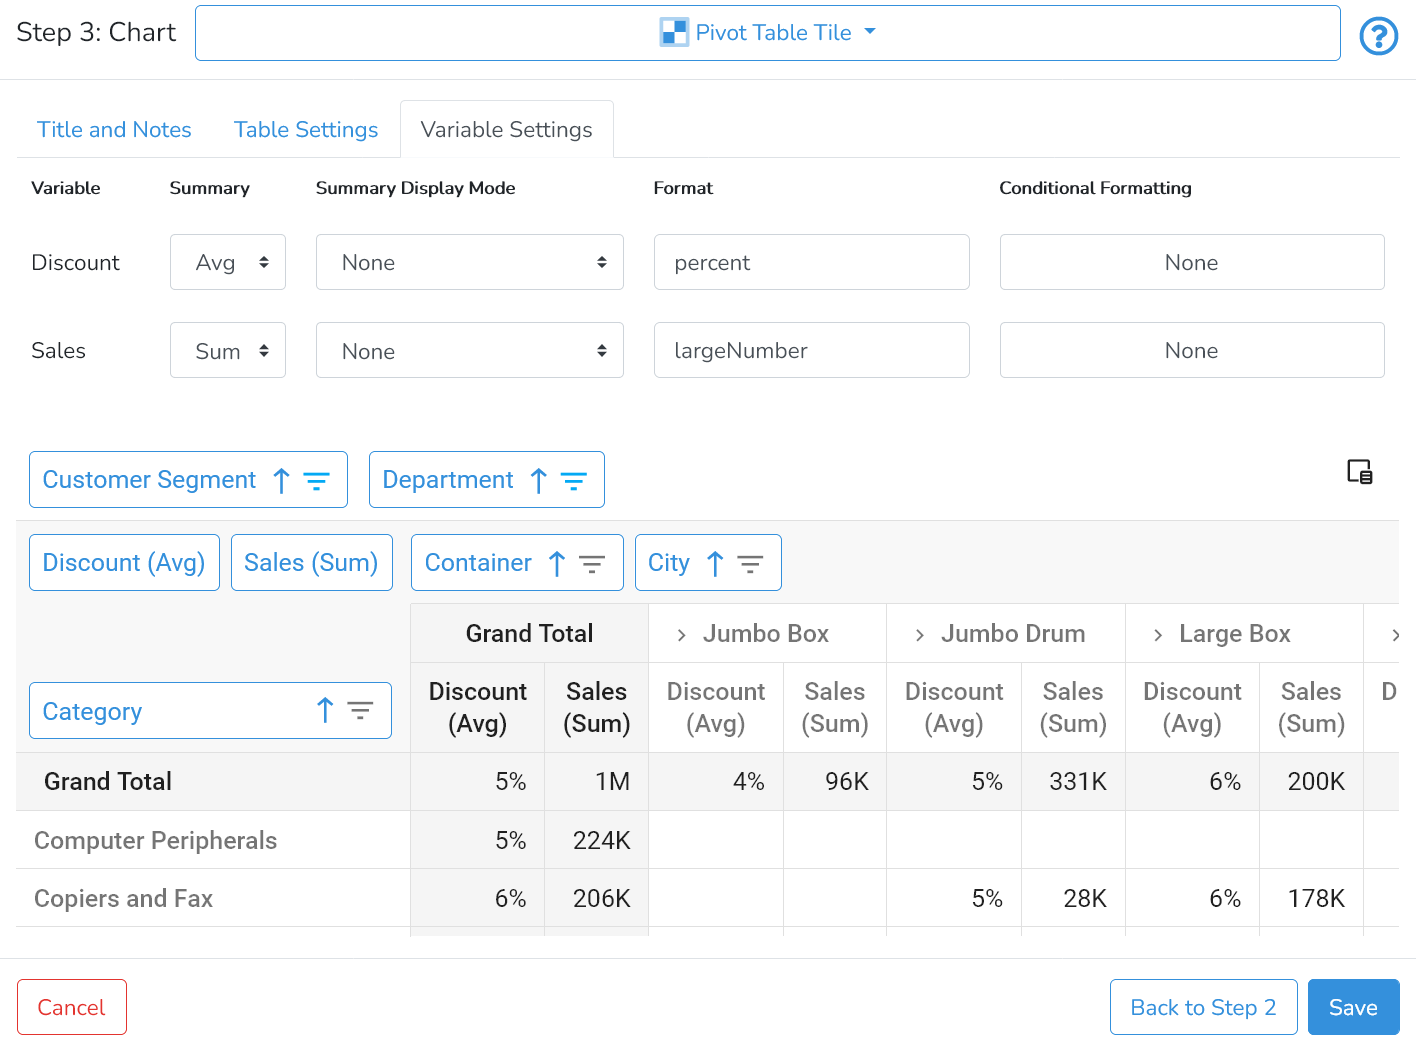
 DataYeet supports several keywords: largeNumber, percent.
largeNumber formatting presents numbers in human-readable format by rounding to the highest count of ones, thousands, millions, and so on.
percent formatting presents numbers by multiplying them by 100 and rounding up to whole values.
Conditional Formatting
Conditional formatting allows users to add conditional background to selected data field variables. By default - there is no conditional formatting. Use the dropdown menu to select appropriate conditional formatting.
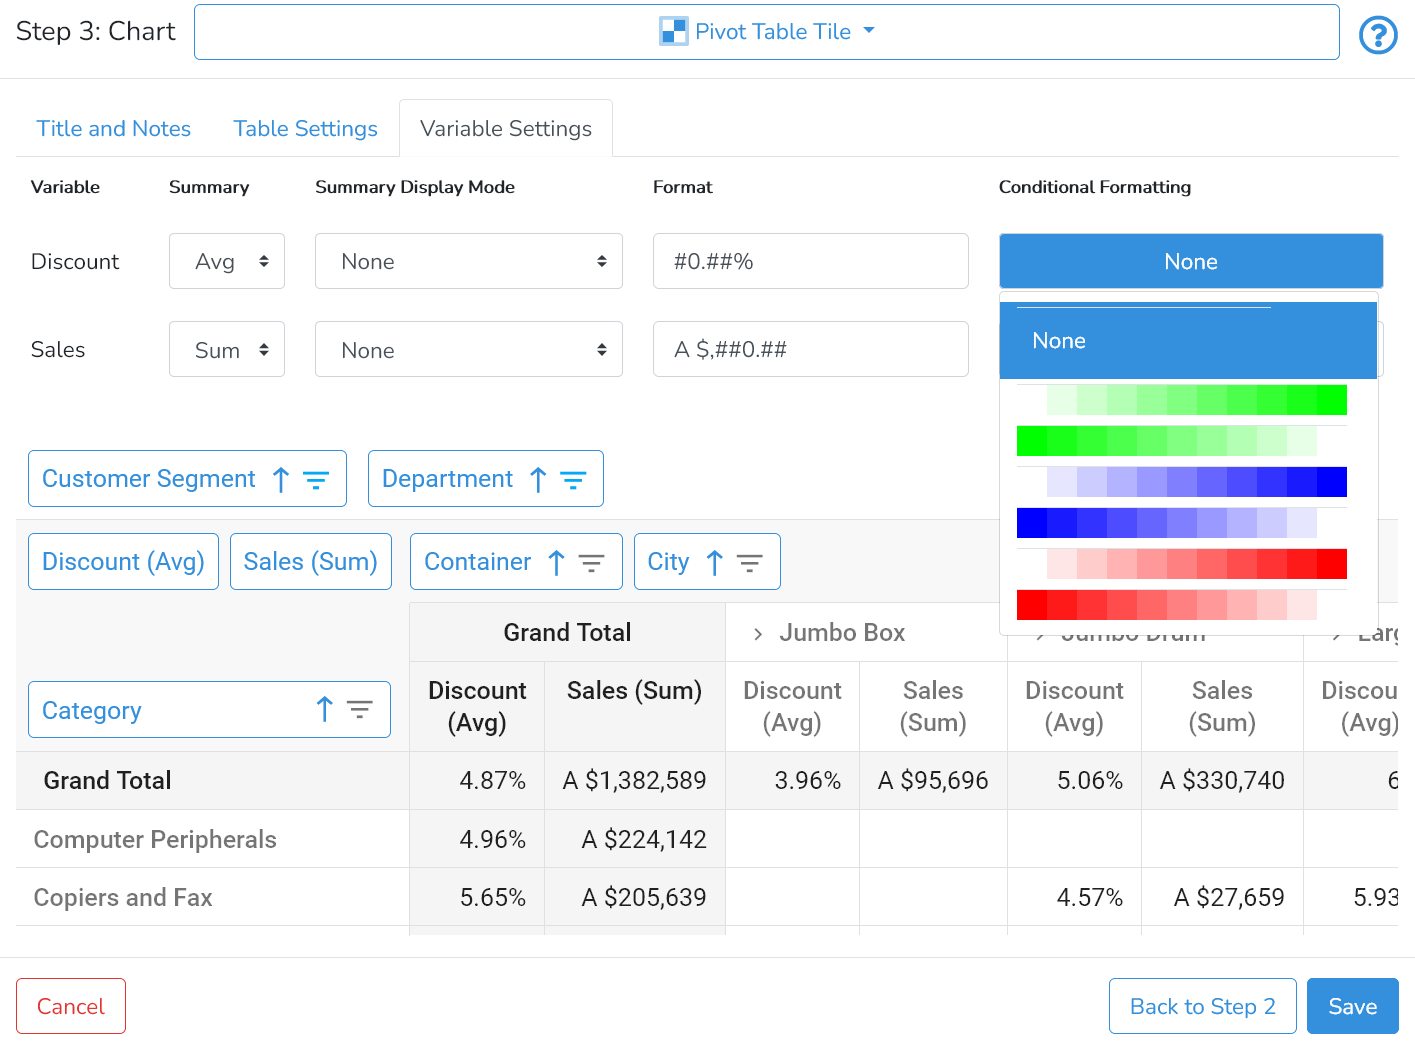 The example below shows conditional formatting for both data fields:
Any settings selected in the previous steps (e.g. the data connection or the table selected) can be modified by clicking on Back to Step 1 or Back to Step 2 in the right bottom corner.
When done, click on Save in the bottom right corner to save all changes.
Next is How-to Manage Users and Groups.